MapLibre Playground
This web app was made because, as soon as I published my Map Editor, I realized it had a lot of issues:
- it was heavy and slow
- it was not optimized
- it had too many workarounds to do even simple tasks
- and so on…
So, I decided to completely rethink what I needed. The primary requirements were:
- a lightweight and fast web app with the usual consolidated stack (Vite/React/TypeScript/MapLibre)
- several custom controls that could be reused as standalone components in new applications
With these ideas in mind, I started diving into the MapLibre documentation again to find inspiration. There were several things that I hadn’t used before, such as the IControl interface. This opened the possibility to create a full set of tools. So, as of now, I have built 20+ custom controls (and counting), each designed as a standalone and reusable React component. Here’s a complete breakdown of their main functionalities, based on arbitrary categories I assigned to them:
Nice to Have
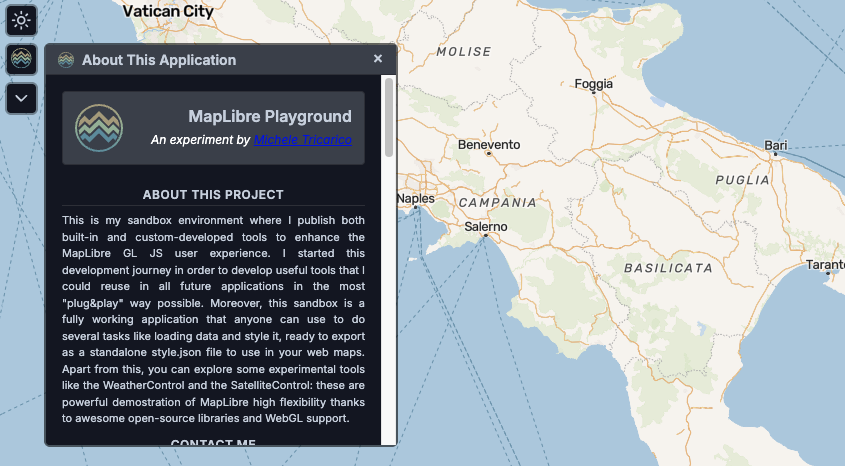
About Control
Displays application information with branding and project details in a dynamic, repositionable panel. Automatically adjusts position on window resize to maintain visibility.
Uses: Browser DOM APIs
Dark Mode Toggle
Seamlessly switches between light and dark themes with smooth icon transitions (Sun/Moon). Applies theme changes via CSS class manipulation to the document body.
Uses: CSS Variables, DOM APIs
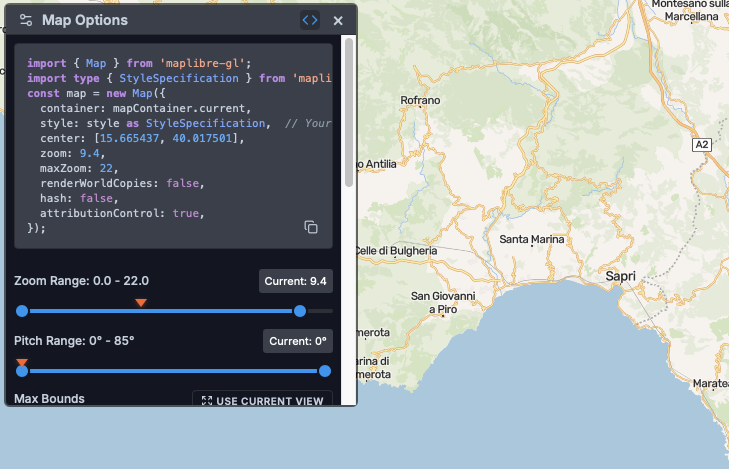
Map Options
Configure map rendering options and behaviors through an expandable settings panel with dynamic positioning. Adjusts panel location relative to the control button and responds to window resize events.
Uses: Browser DOM APIs
Share Control
Generates shareable URLs encoding the complete map state (center, zoom, bearing, pitch, basemap style) in the URL hash. Copies to clipboard using the Clipboard API with visual feedback (Check icon). Includes fallback modal for manual copying when clipboard access is unavailable.
Uses: Clipboard API, URL Hash manipulation
Navigation
Go Home Control
Instantly returns to the default location (Rome: 12.496366, 41.902782) using MapLibre’s flyTo() animation with a smooth 1-second transition.
Uses: MapLibre Animation API
Go to Location
Navigate to custom coordinates using intelligent format detection: Google Maps URLs (@lat,lng), decimal degrees (40.123, -74.456), or DMS format (40°42’46”N). Places a visual marker at the destination with animated 3-second fly transition featuring curve and speed parameters. Features expandable input field with clear button.
Uses: MapLibre Marker API, Regex parsing, Coordinate conversion
Map Info Control
Real-time viewport information display with dual modes: collapsible panel or persistent overlay. Shows center coordinates (lat/lng), extent bounds (N/S/E/W), zoom level, pitch, and bearing. Updates are throttled at 50ms intervals for optimal performance. Automatically repositions on window resize.
Uses: MapLibre Events, Event Throttling, Window Resize API
Reset Bearing
Resets map rotation to 0° (north-up orientation) using MapLibre’s easeTo() animation with smooth 500ms easing transition.
Uses: MapLibre Animation API
Reset Pitch
Resets map tilt to 0° (flat, overhead view) using MapLibre’s easeTo() animation with smooth 500ms easing transition.
Uses: MapLibre Animation API
Web Cartography
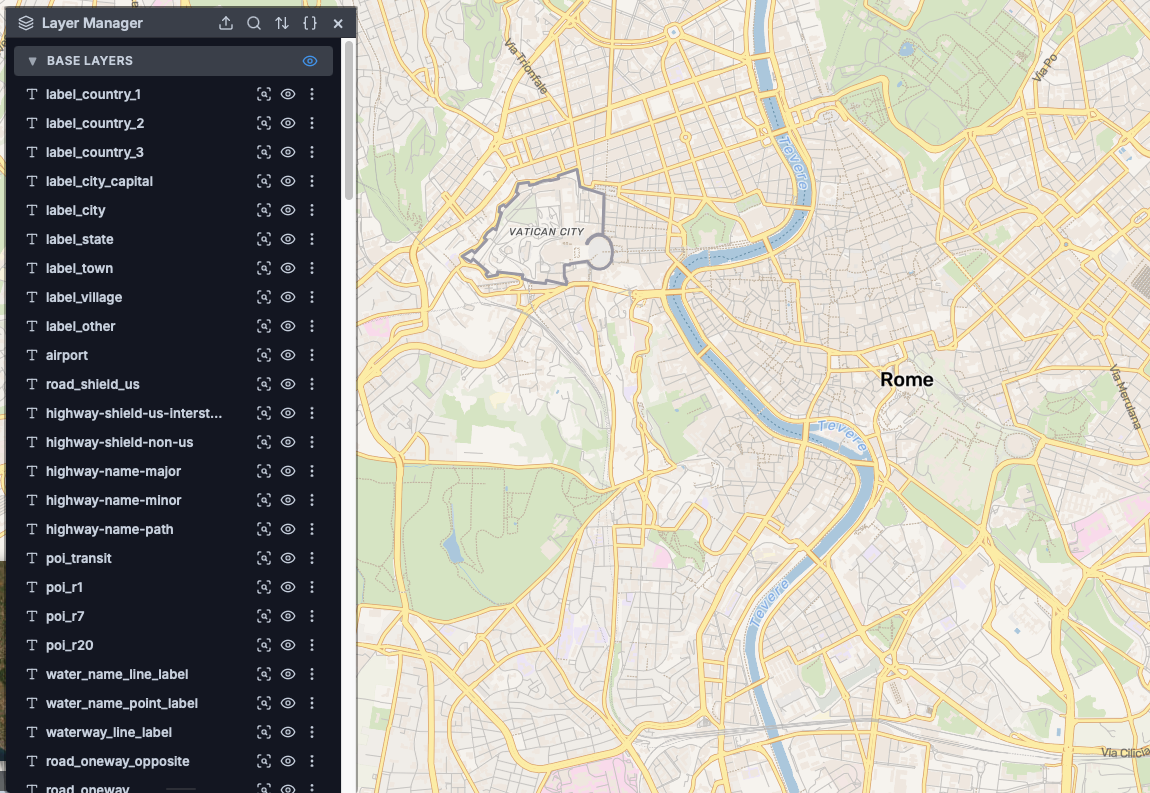
Layer Manager
Complete layer control system with visibility toggles, drag-drop reordering, and layer deletion. Features advanced styling for layout/paint properties and filters, zoom-to-extent with PMTiles/vector/raster support, attribute table viewer with field selection, feature popups with hover effects using feature state, and full style JSON viewer. Includes custom image generation for fallback sprites using Canvas API.
Uses: Turf.js (bbox calculations), MapLibre Feature Query API, Canvas API
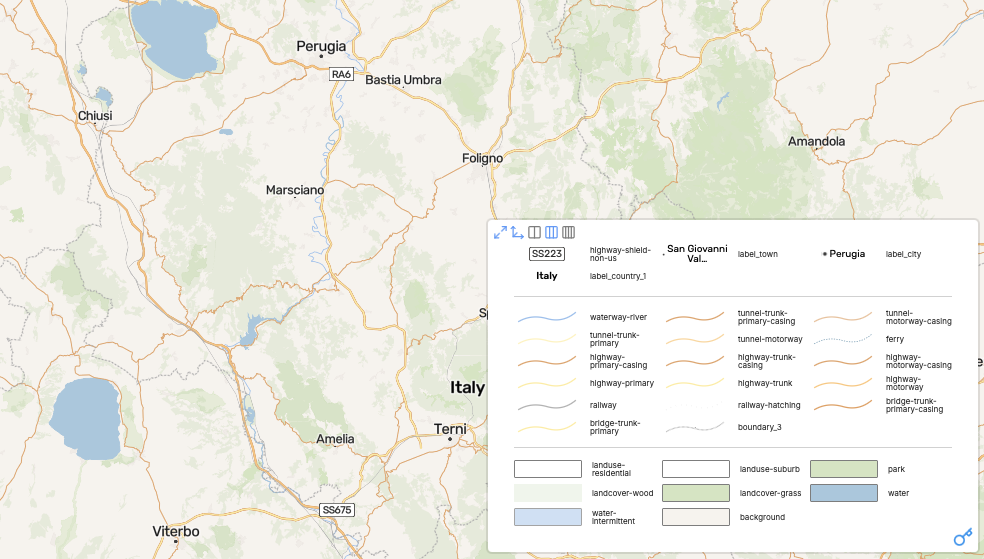
Map Legend
Dynamic legend rendering with automatic symbol and color extraction from all visible layers. Offers flexible column layouts (2, 3, or 4 columns), minimize/maximize modes, vertical resize handles for user control, and auto-height calculation. Generates custom SVG symbols for fill, line, circle, and symbol layers using Canvas-based rendering.
Uses: Canvas API, SVG generation, Dynamic styling
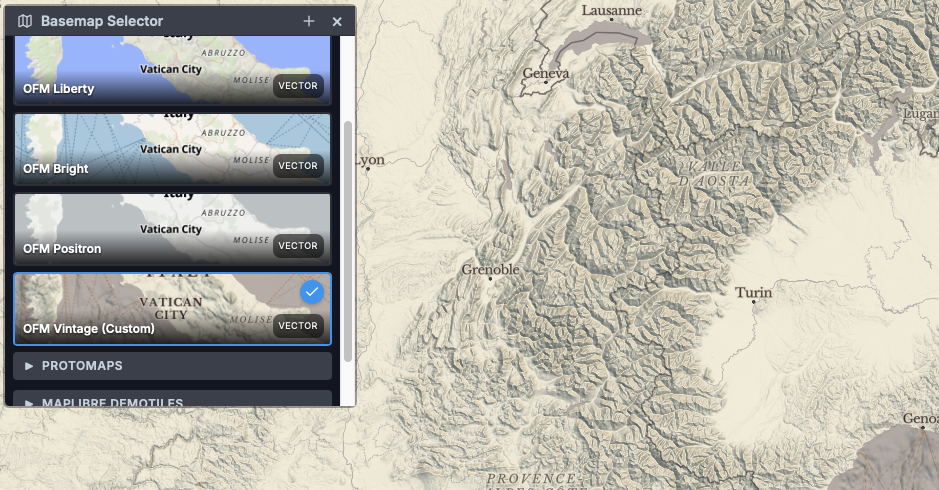
Basemap Selector
Seamlessly switch between 12+ predefined basemaps (OFM Bright, Liberty, Positron, Vintage, Protomaps Light/Dark, MapLibre Demotiles, OpenStreetMap, Esri Satellite) or add custom tile URLs. Preserves overlay layers across basemap changes, automatically discovers and updates fonts for symbol layers, maintains map projection settings, and generates raster styles from tile URLs. Includes thumbnail previews.
Uses: Font discovery utility, Style JSON validation, Raster style generation
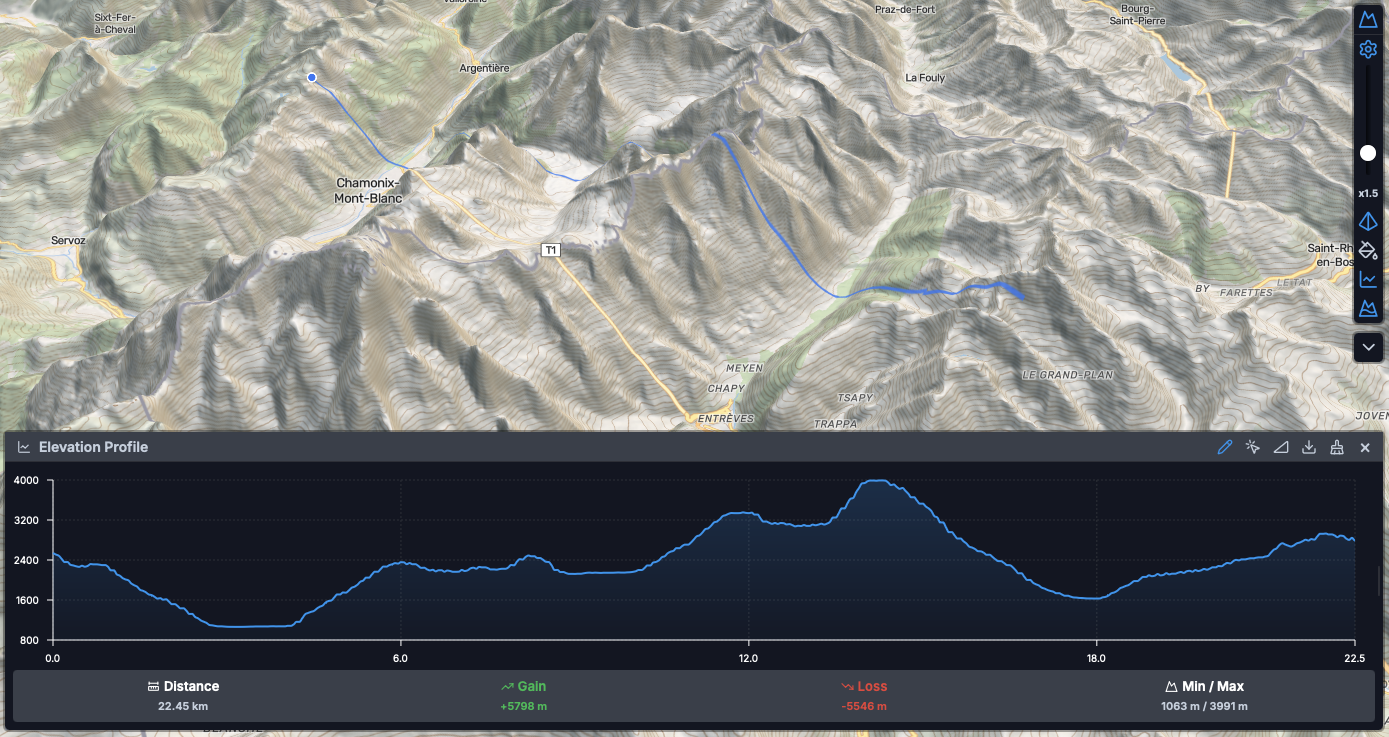
Enhanced Terrain
Advanced DEM visualization toolkit featuring adjustable vertical exaggeration (0-10x) via rotated slider, hillshade layer with customizable lighting direction and illumination anchor, color relief mapping with elevation-based interpolation (-400m to 7000m+), and adaptive contour generation with zoom-dependent intervals. Includes elevation profile drawing tool with line/select modes, vertex distance tracking, and asynchronous calculation using Web Workers. Supports both tiled DEM and COG sources with terrarium/mapbox encoding.
Uses: maplibre-contour, Turf.js, Web Workers (elevation-profile-worker), MapLibre Marker API
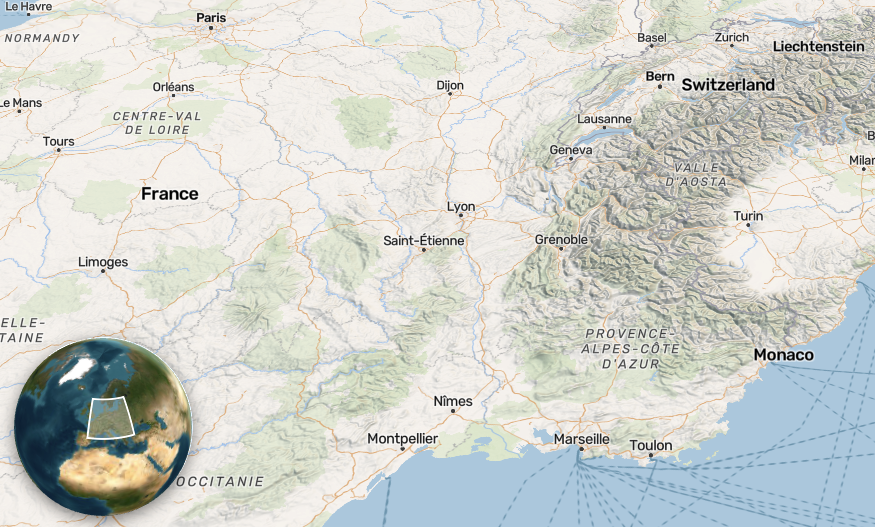
Minimap
Secondary embedded MapLibre instance displaying full map extent with viewport bounds visualization. Features two-way synchronization (minimap drag updates main map), configurable zoom offset (default 4 levels), optional globe projection mode (vertical-perspective), interactive or read-only variants, and automatic hiding at low zoom levels (< 4). Uses GeoJSON source for extent rectangle rendering with canvas buffer preservation.
Uses: Nested MapLibre instance, GeoJSON sources, Canvas API
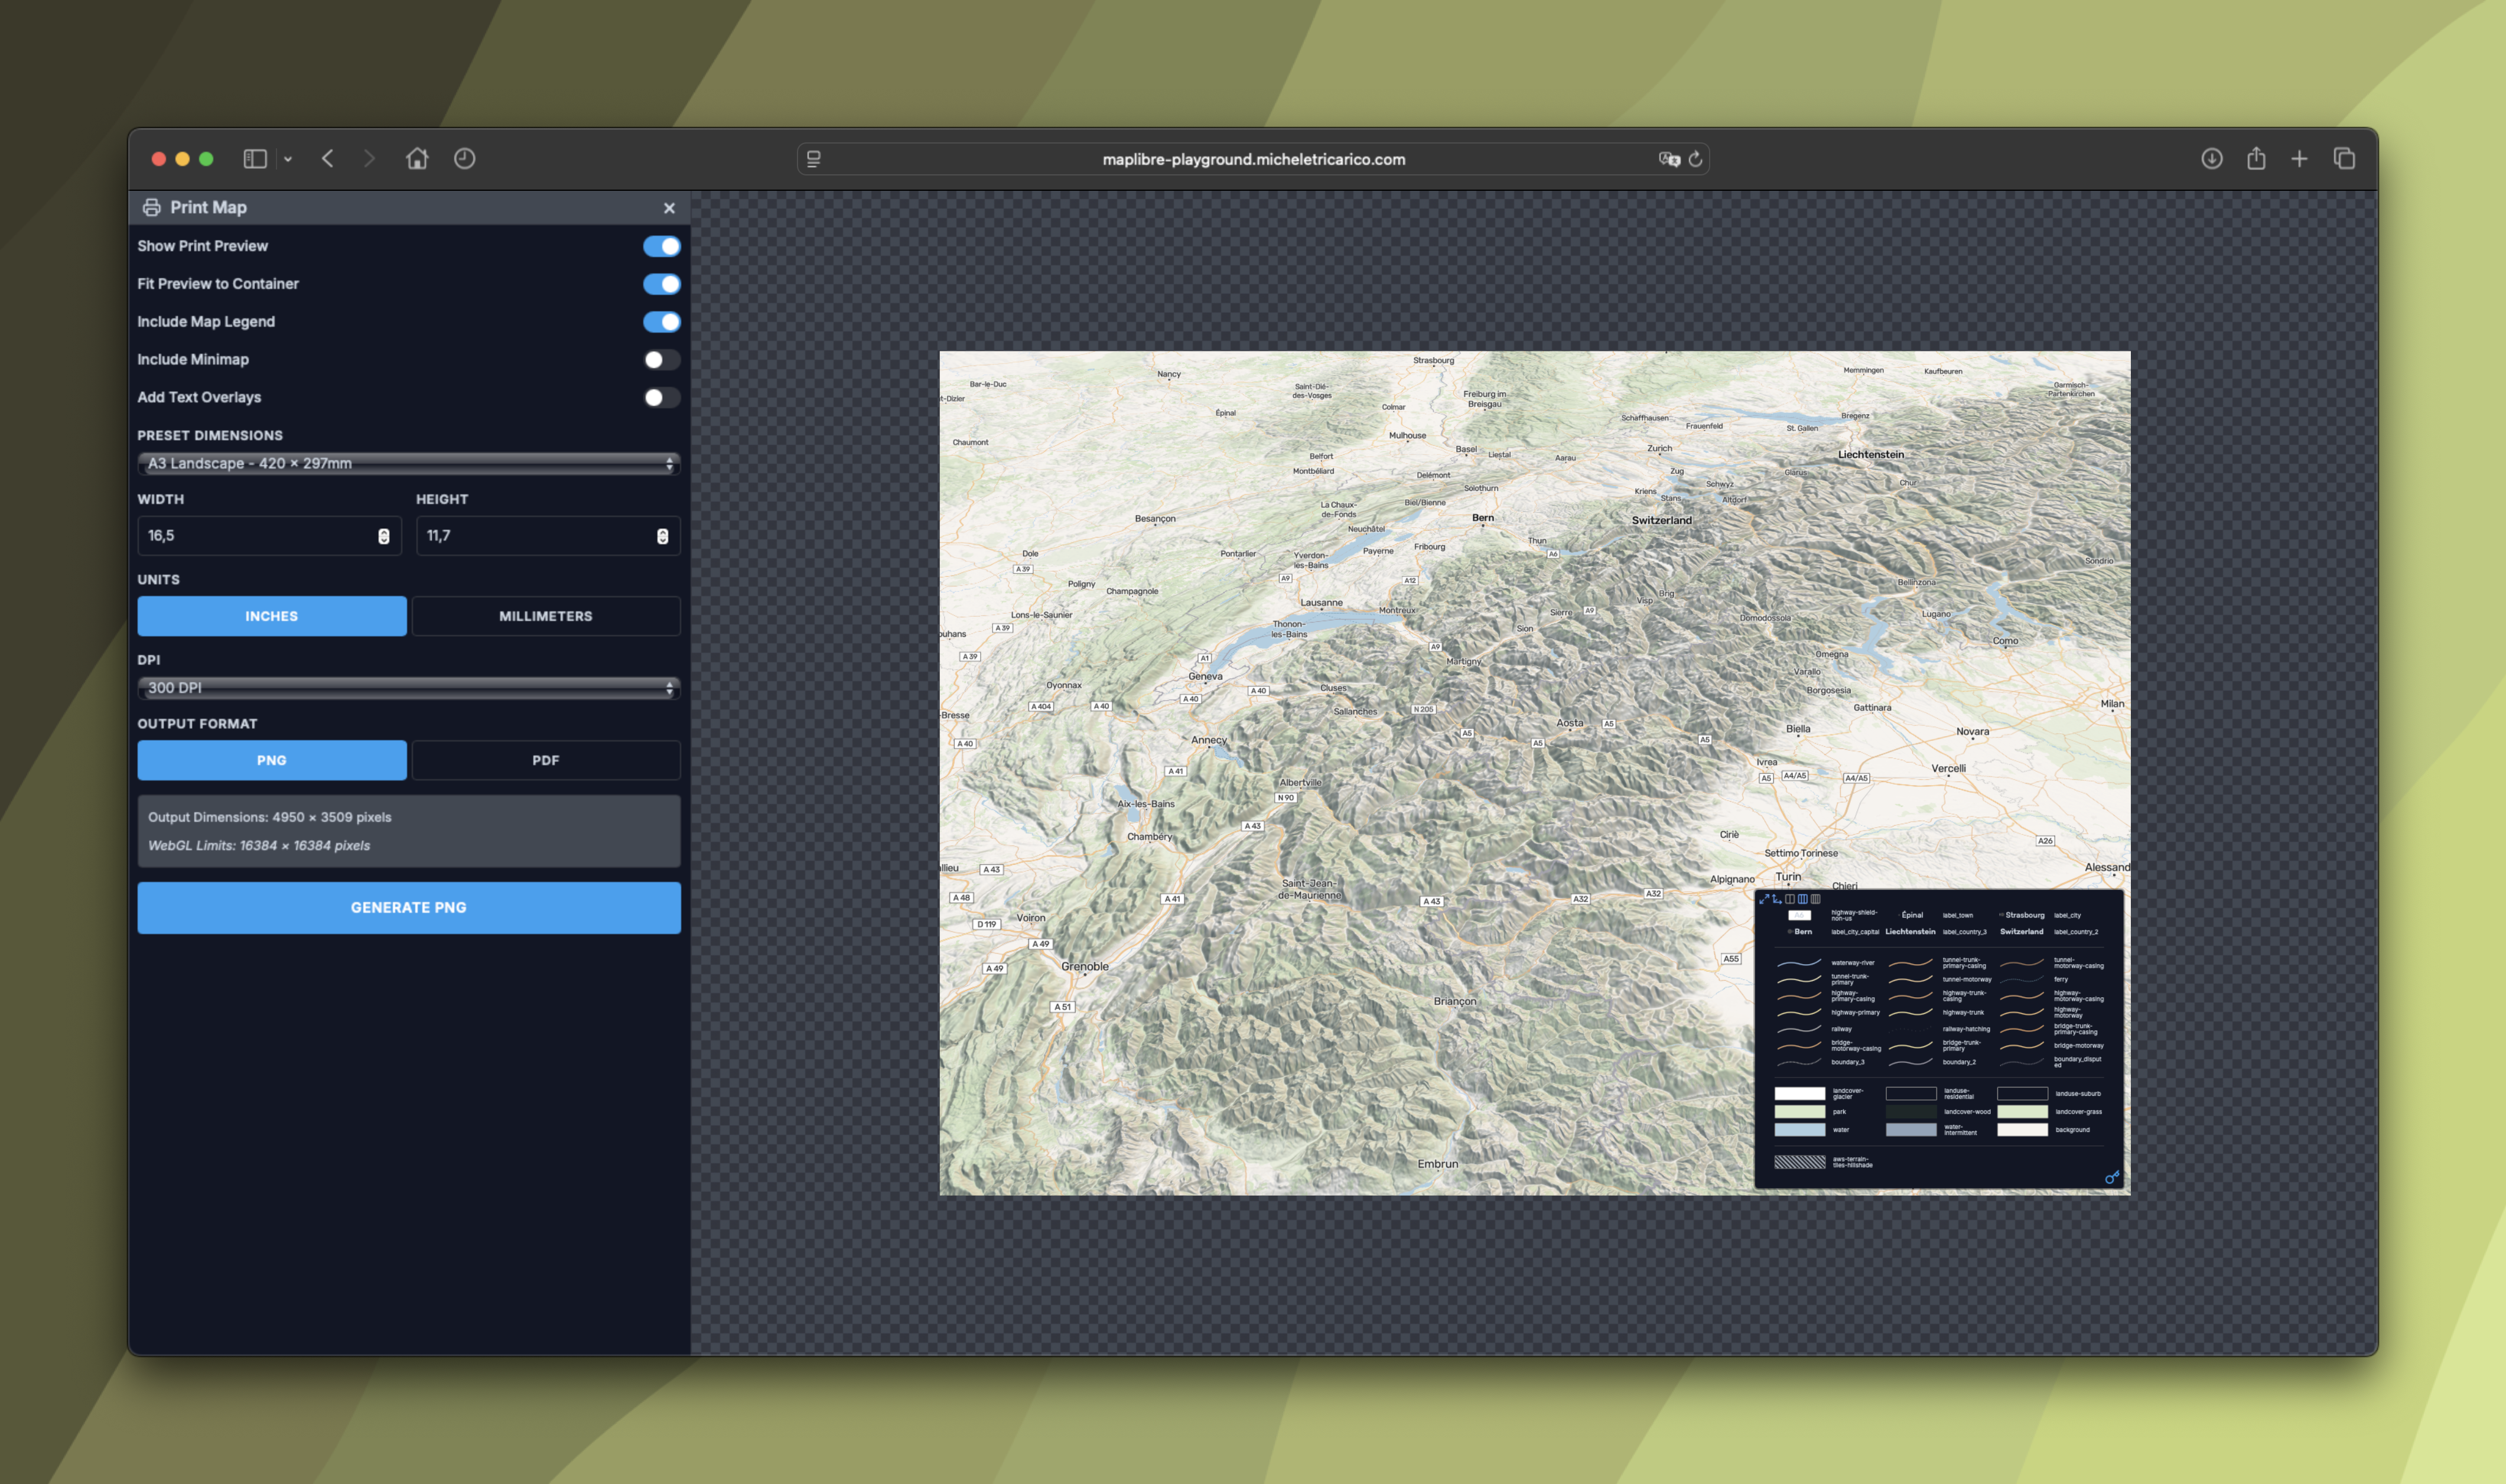
Print Control
Professional map printing interface with responsive layout modes: desktop (25% panel + 75% map preview) and mobile (footer layout). Features customizable dimensions (A4, A3, Letter, custom sizes), resolution/DPI options, landscape/portrait orientation, optional legend/minimap display, and automatic control hiding during print mode. Uses full-screen layout manipulation (position: fixed, 100vw/100vh) with sidebar panel sizing.
Uses: CSS Layout manipulation, Media queries, Map resize management
Experiments
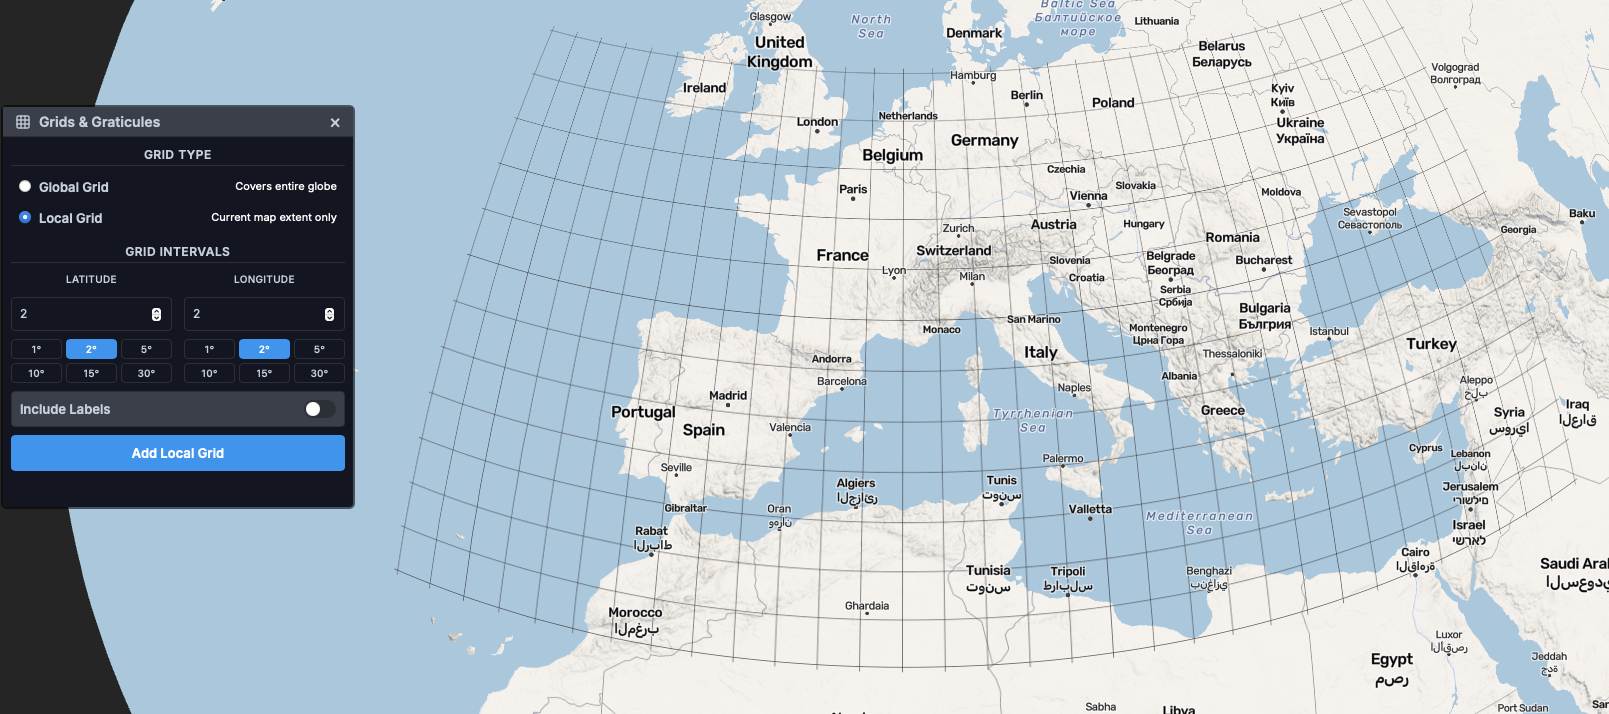
GeoGrid
Generates geographic coordinate grid overlays as GeoJSON line features with two modes: global grid (Web Mercator bounds: ±85.0511° latitude) and local viewport-relative grid. Features customizable latitude/longitude intervals, multiple label formats (degrees, decimal, DMS), dynamic text sizing based on coordinate importance, and text-optional placement to prevent overlap. Automatically adjusts grid density based on zoom level.
Uses: GeoJSON generation, Coordinate formatting, Text placement optimization
Satellite Tracker
Real-time satellite orbital tracking using TLE (Two-Line Element) data from CelesTrak. Features categorized satellite browser (communications, Earth observation, navigation, weather), multiple constellation support (Starlink, Iridium, GPS, ISS), animated trajectories with adjustable speed multipliers, individual satellite selection and highlighting, customizable appearance (point color, opacity, size), and pre-calculated trajectory paths. Uses Web Worker pools for asynchronous orbit calculations with memory management and deep cleanup for large datasets.
Uses: Web Workers (satellite trajectory calculation), TLE parsing, Orbit propagation algorithms
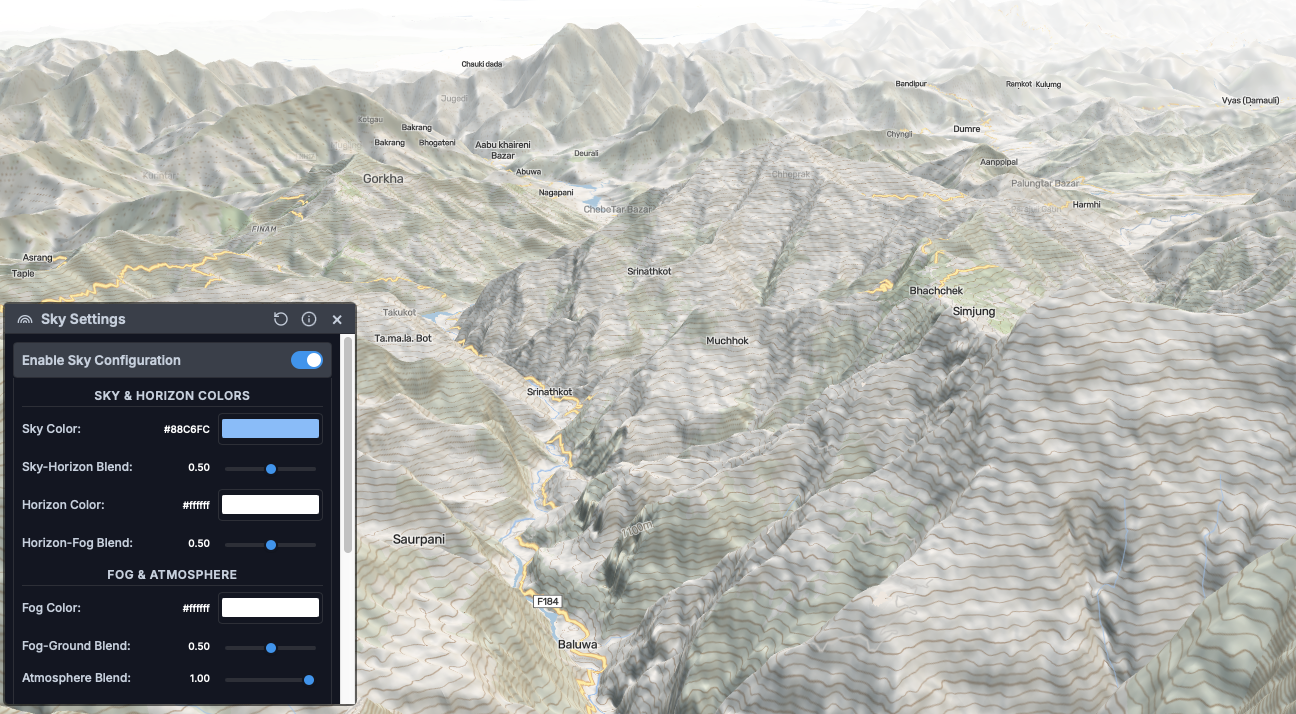
Sky Settings
Configure MapLibre’s atmospheric rendering system with real-time paint property adjustments: sky color, horizon color, fog color and blending, atmosphere blending, and horizon-fog blend ratio. Provides intuitive color pickers and sliders for creating immersive 3D atmospheric effects. Panel repositions dynamically on window resize.
Uses: MapLibre Sky Layer paint properties, Color picker UI
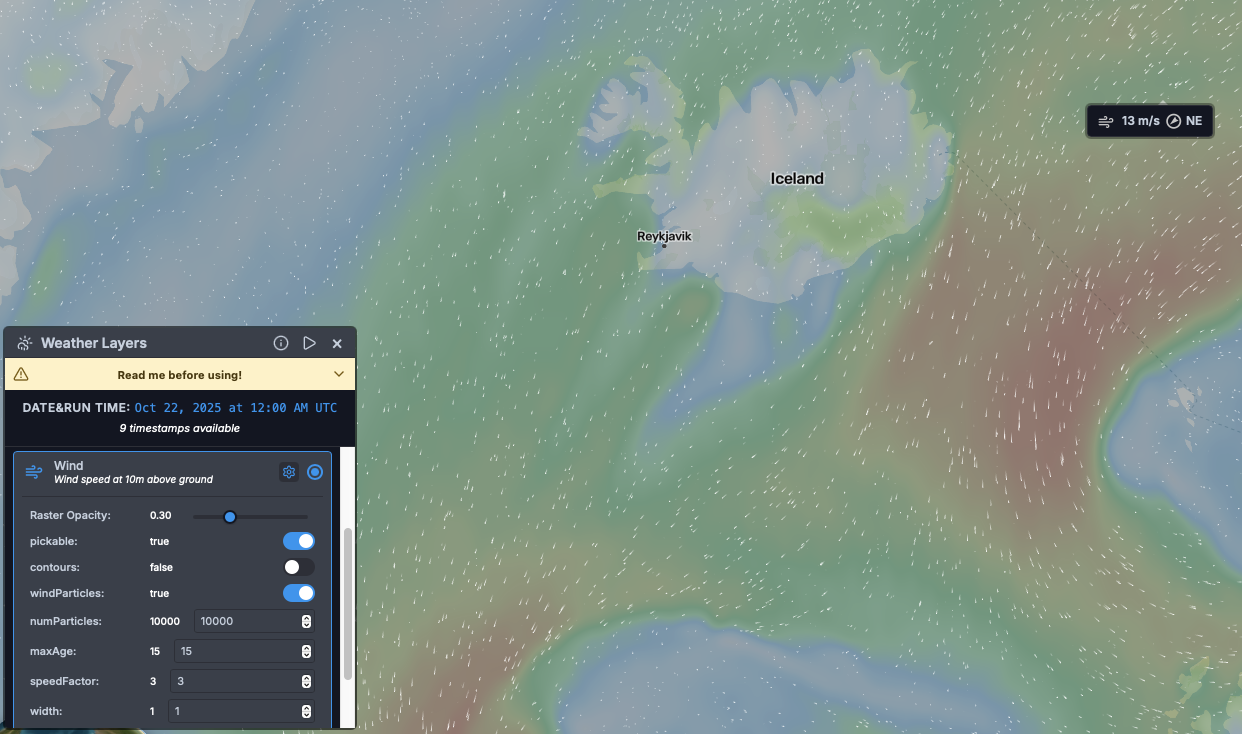
Weather Control
Real-time weather data visualization using Deck.gl overlay integration. Supports multiple layer types: wind (particle effects with optional barbs), temperature (color-mapped interpolation), cloud cover (opacity-based visualization), and reflectivity/radar (precipitation intensity). Features timeline navigation with timestamp interpolation, texture caching with memory leak prevention, projection change handling (Mercator/Globe via GlobeView), custom cursor management, and asynchronous weather data loading. Integrates with LayerManager for proper layer tracking.
Uses: Deck.gl (@deck.gl/mapbox, @deck.gl/core), weatherlayers-gl, Texture caching, Custom data managers
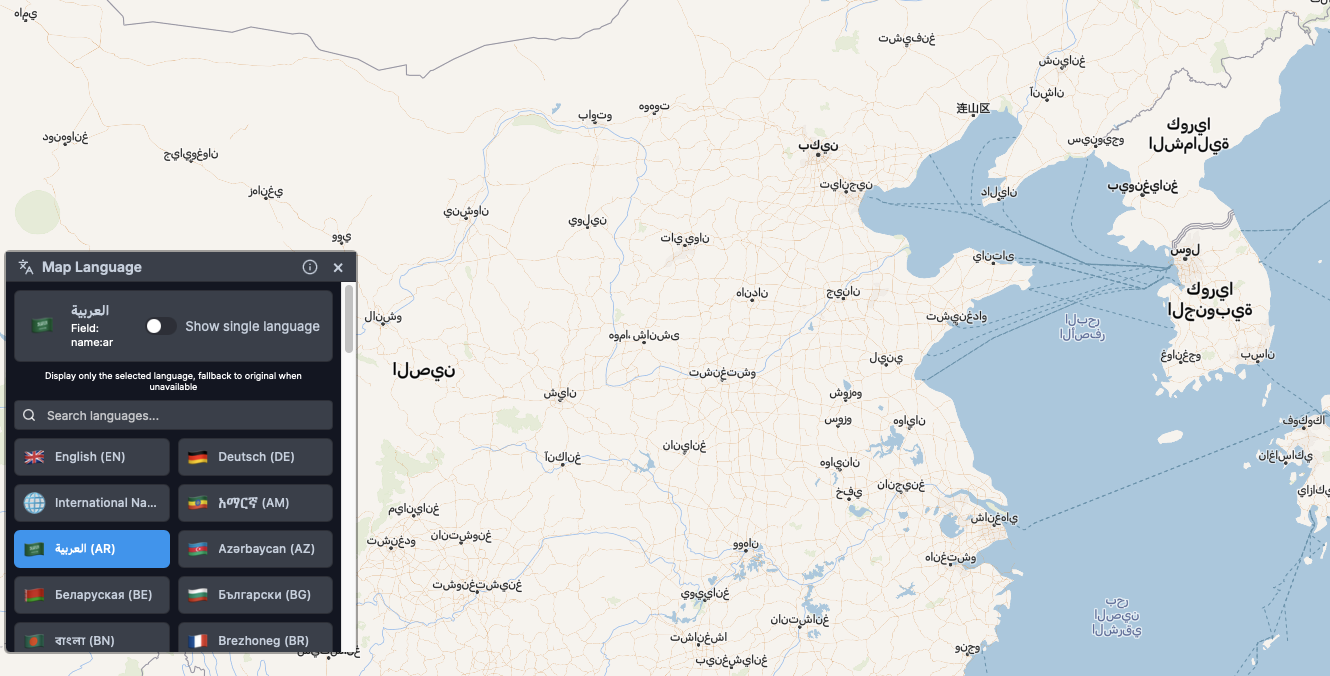
Translator
Multi-language map label system with 50+ language support and flag emoji indicators. Automatically discovers available languages by scanning symbol layer text-field expressions and querying vector source features. Supports multiple naming conventions: name (English), name:xx (colon format), name_xx (underscore format). Offers single-language or bilingual display modes (selected language + original name in parentheses). Includes comprehensive OpenMapTiles schema support with fallback to English when selected language is unavailable. Dynamically creates MapLibre expressions for text-field updates.
Uses: MapLibre Expression parsing, Vector source feature querying, Language field detection
What’s Next?
I plan to open-source these custom controls in the future, making them available for the MapLibre community to use and contribute to. However, before doing so, I need to complete further refinements, bug fixes, and documentation to ensure they’re production-ready. Don’t expect this to happen anytime soon, as I want to make sure everything is properly polished and tested.
If you’re interested in following this project’s development or want to be notified when the controls become available, feel free to follow my GitHub profile. In the meantime, you can explore and test all the controls in the live web app.
If you’re particularly interested in one or more of these custom controls for your company’s application or a similar project, feel free to reach out to me to discuss potential collaboration or custom development opportunities.